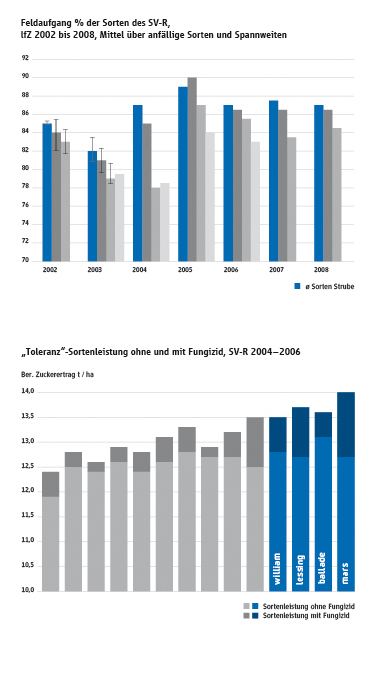
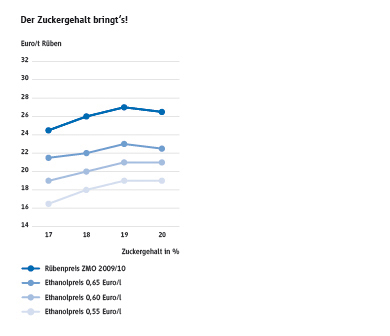
Diagram
Diagrams are used for graphical illustration of quantity comparisons or quantity developments. For the Strube diagramme types uniform templates are available in which variable values can be noted. Colours and labels comply with the Strube Corporate Design. The size of the diagrams depend on the column width of the respective publication. These guidelines are based on the graphical possibilities of the programme Adobe Illustrator, in which the template files are available.
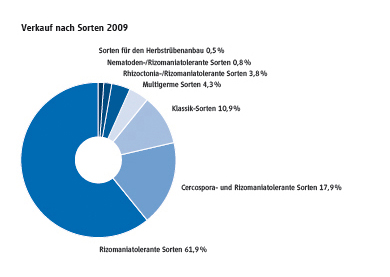
Pie charts
Pie charts illustrate the shares of individual values of the total value (100%) as single pieces of a pie.
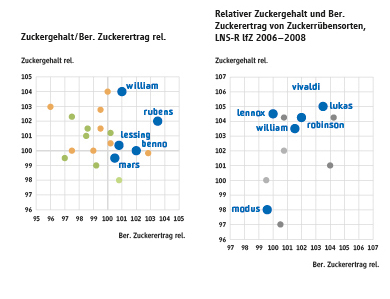
Scatter diagrams
Relations within comparative values, e.g. product data about Strube and its competitors; can be visualized by scatter diagrams.
For the comparison with competitors corresponding colours are determined; Strube varieties are presented in blue and in the font Strube Black.